Observational field note
When the Pressure Fell
An EDS observational field note on successive Atlantic storm passages recorded in Espinho during early 2026.
20 January to 10 March 2026 · local station record · UTC
Observation window
A continuous local record through a crowded winter.
The study uses the Espinho EDS station record from 20 January through 10 March 2026. A preserved BSON snapshot was restored in a network-isolated, read-only extraction process. The operational database was not contacted.
Minute-bin coverage is the continuity measure. The extraction contains 71,571 telemetry rows, including 107 additional readings inside already occupied minute bins. Those rows are retained and are not presented as extra minutes.
Name-blind screening
The station trace came before the storm name.
Candidate pressure episodes were identified from the station record without using named-event dates. Only after those candidates were fixed were they compared with official IPMA, ANEPC and APA material.
This order reduces the risk of selecting a pressure feature simply because a known storm name makes it look important.
- 01 · Aggregate
Build valid hourly means
Hours require at least 50 valid sea-level-pressure samples.
- 02 · Screen
Apply frozen pressure thresholds
Mark falls of at least 6 hPa in 3 hours, 10 hPa in 6 hours or 16 hPa in 12 hours, with an approved low-pressure alternative.
- 03 · Align
Compare with official windows
Add a name only where an authoritative source supports the overlapping period.
Method boundary: these thresholds are a reproducible event-screening contract. They are not a meteorological storm classification, a forecast model or a national warning threshold.
Event sequence
Five windows. Three supported sequences. Two necessary negatives.
Every approved comparison window remains visible. Supported means a frozen-threshold station episode overlaps an independently documented official sequence. It does not mean EDS measured regional storm intensity.
-
01
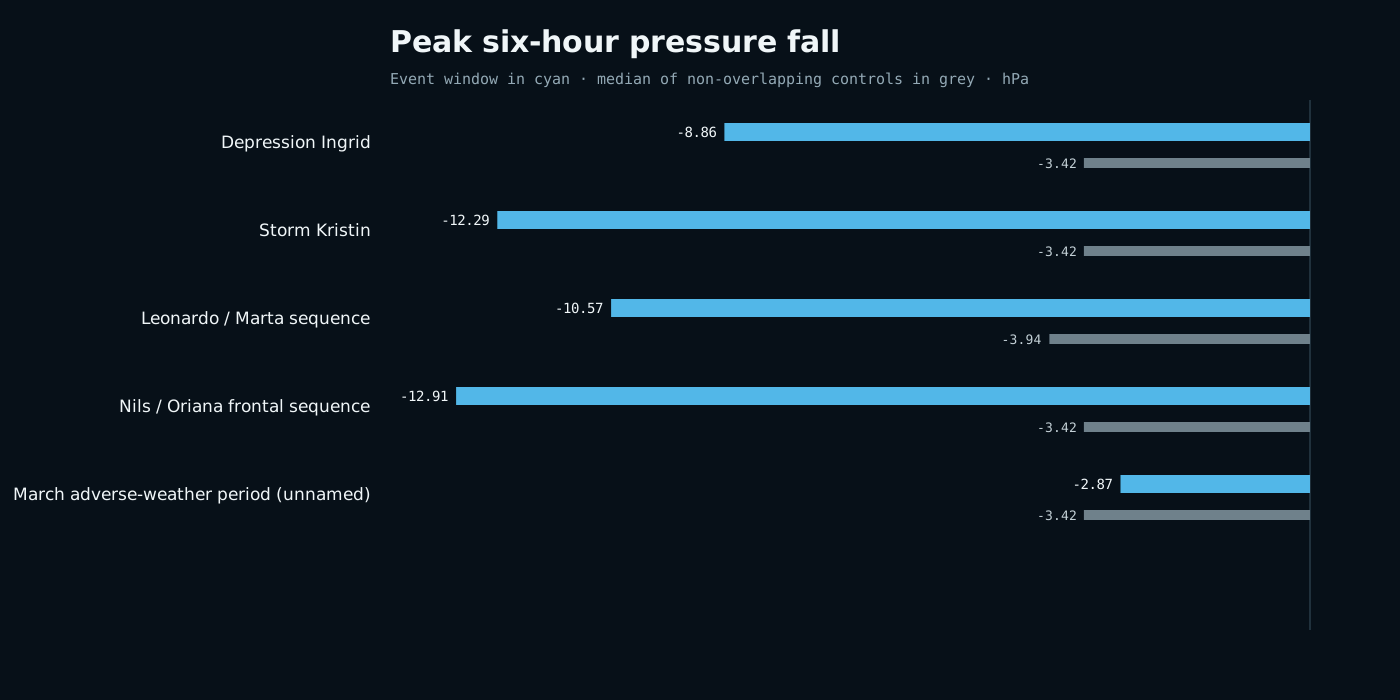
Ingrid21 to 24 January-8.855 hPaPeak 6 h fallNoticeable, below threshold
-
02
Kristin27 to 30 January-12.288 hPaPeak 6 h fallSupported
-
03
Leonardo / Marta3 to 8 February-10.568 hPaPeak 6 h fallSupported
-
04
Nils / Oriana10 to 14 February-12.911 hPaPeak 6 h fallSupported
-
05
March adverse-weather period5 to 7 March, unnamed-2.866 hPaPeak 6 h fallNo major local signature
Supported events
Three different pressure stories.
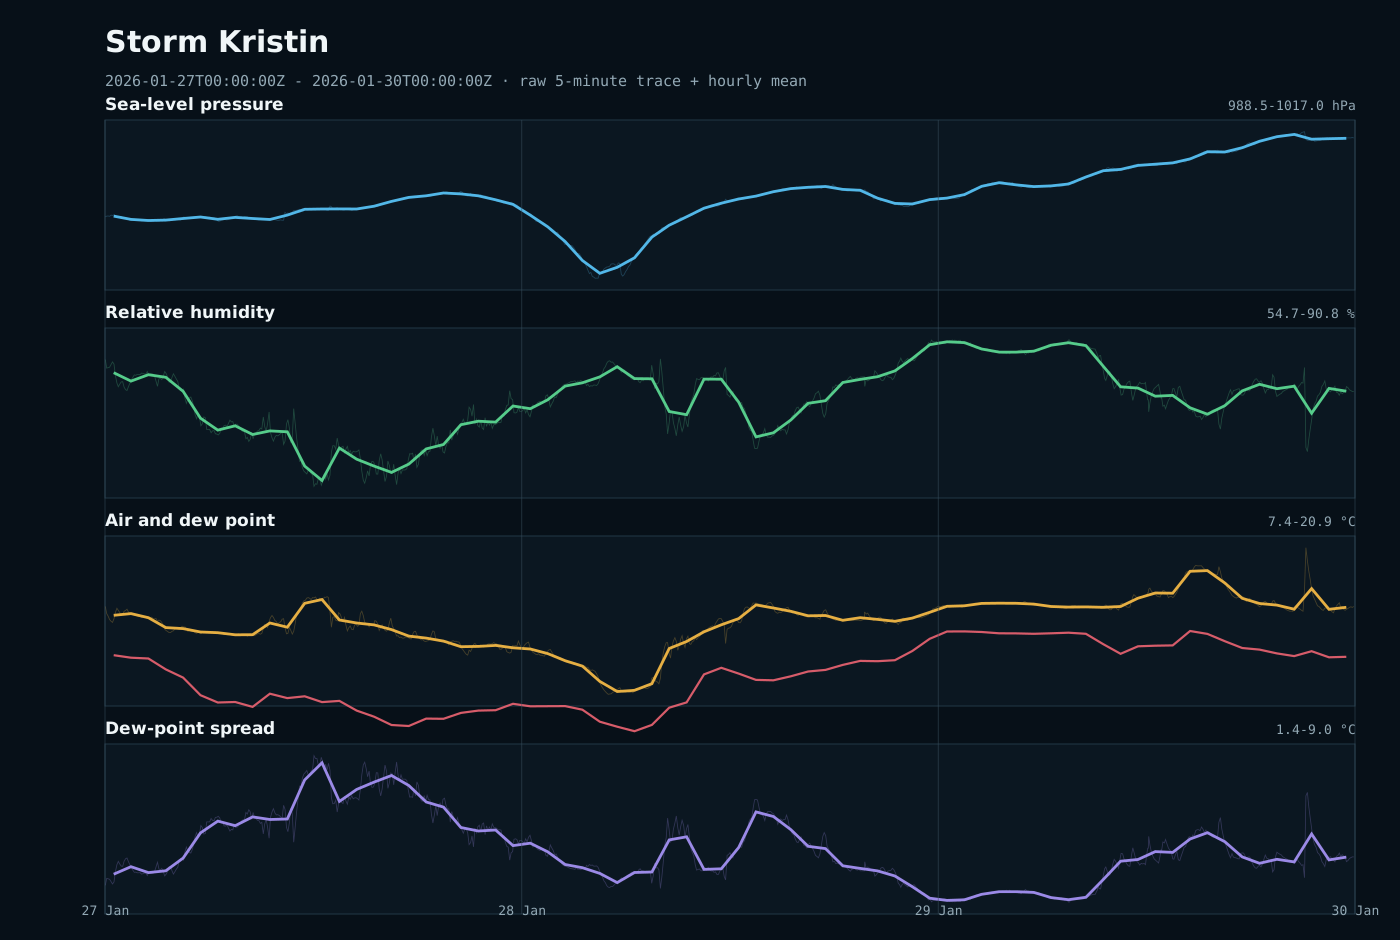
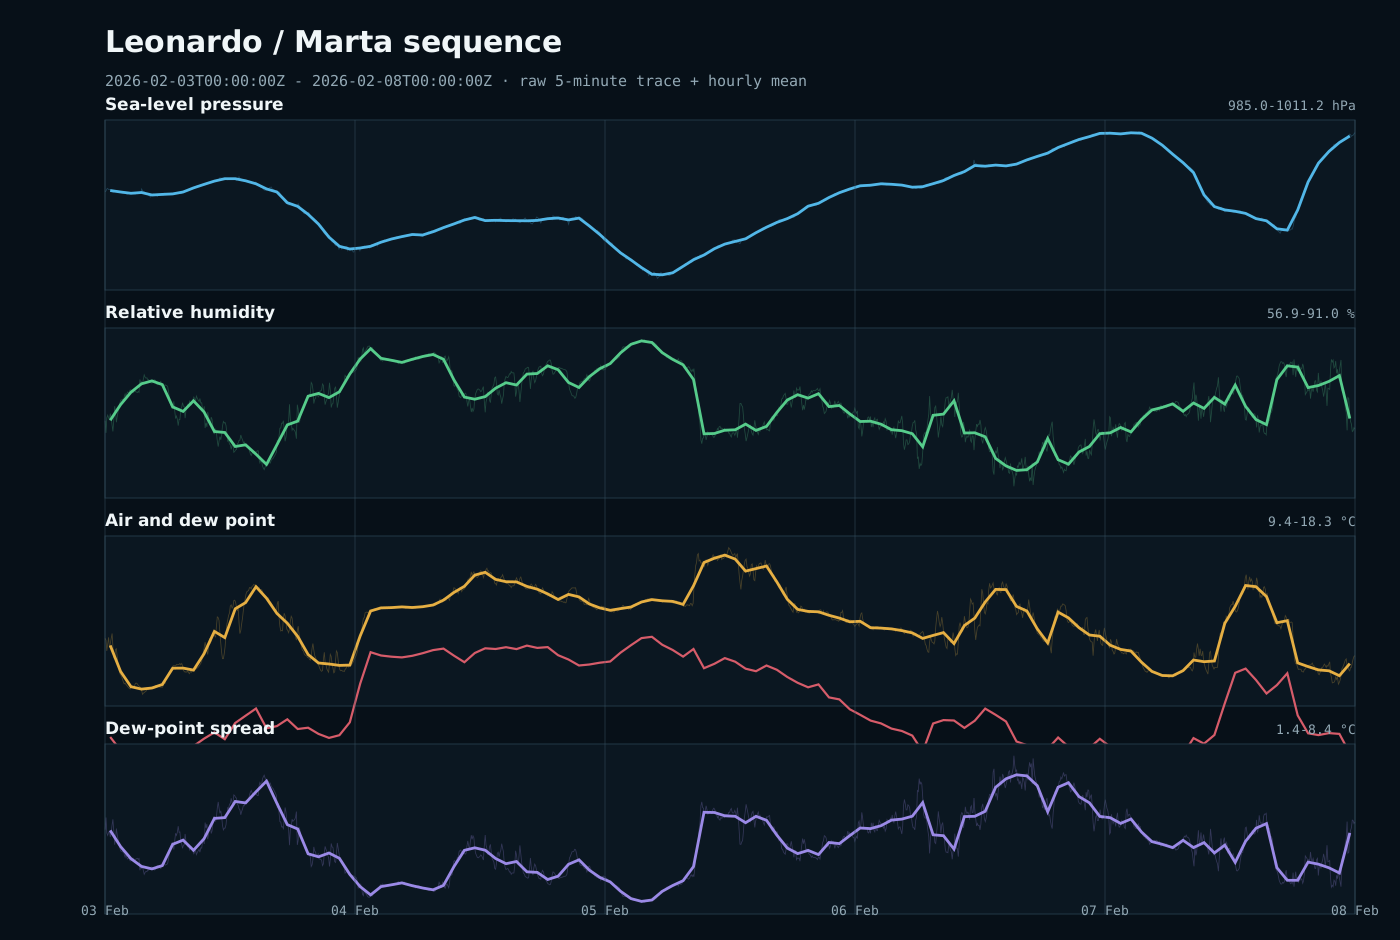
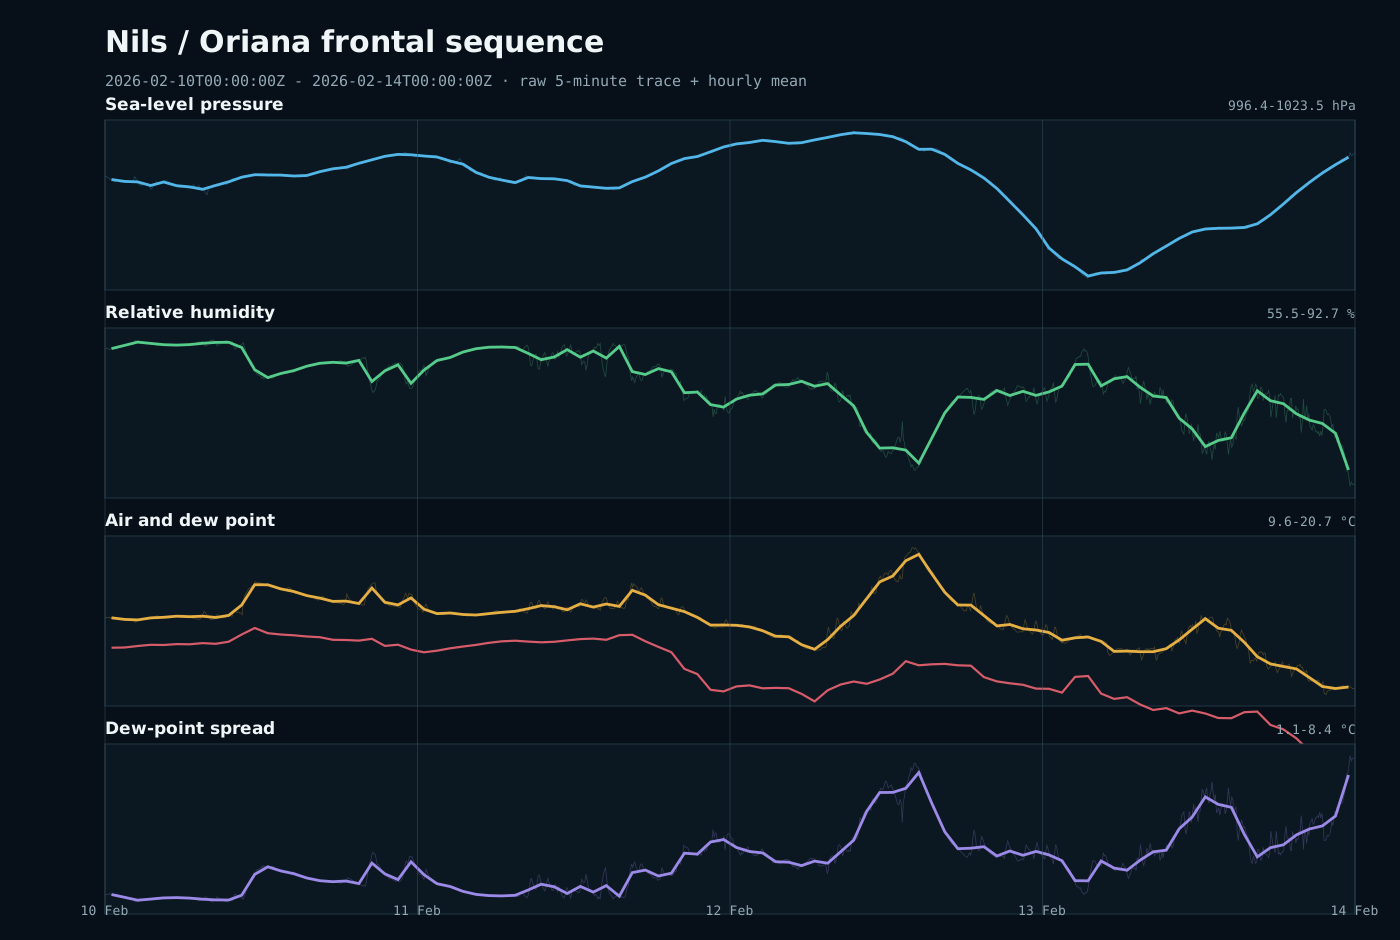
The aligned figures show raw five-minute traces and hourly means across pressure, relative humidity, air and dew point, and dew-point spread. Each official window is a comparison frame, not an exact claim about local arrival or departure.
Kristin · supported
The cleanest precisely timed example.
The station recorded a -12.288 hPa peak six-hour fall. IPMA independently places Kristin's explosive cyclogenesis between 21:00 UTC on 27 January and 03:00 UTC on 28 January.
 Enlarge figure
Leonardo / Marta · supported
A sequence, not one isolated pulse.
The 3 to 8 February window contains multiple frozen-threshold episodes and a -10.568 hPa peak six-hour fall. The broad label preserves the official sequence instead of assigning every local pulse to Leonardo alone.
 Enlarge figure
Nils / Oriana · supported
The strongest local transition.
This window records a -12.911 hPa peak six-hour fall and the largest 12-hour fall among all five defined windows.
 Enlarge figure
Strongest local transition
A twenty-hectopascal fall in twelve hours.
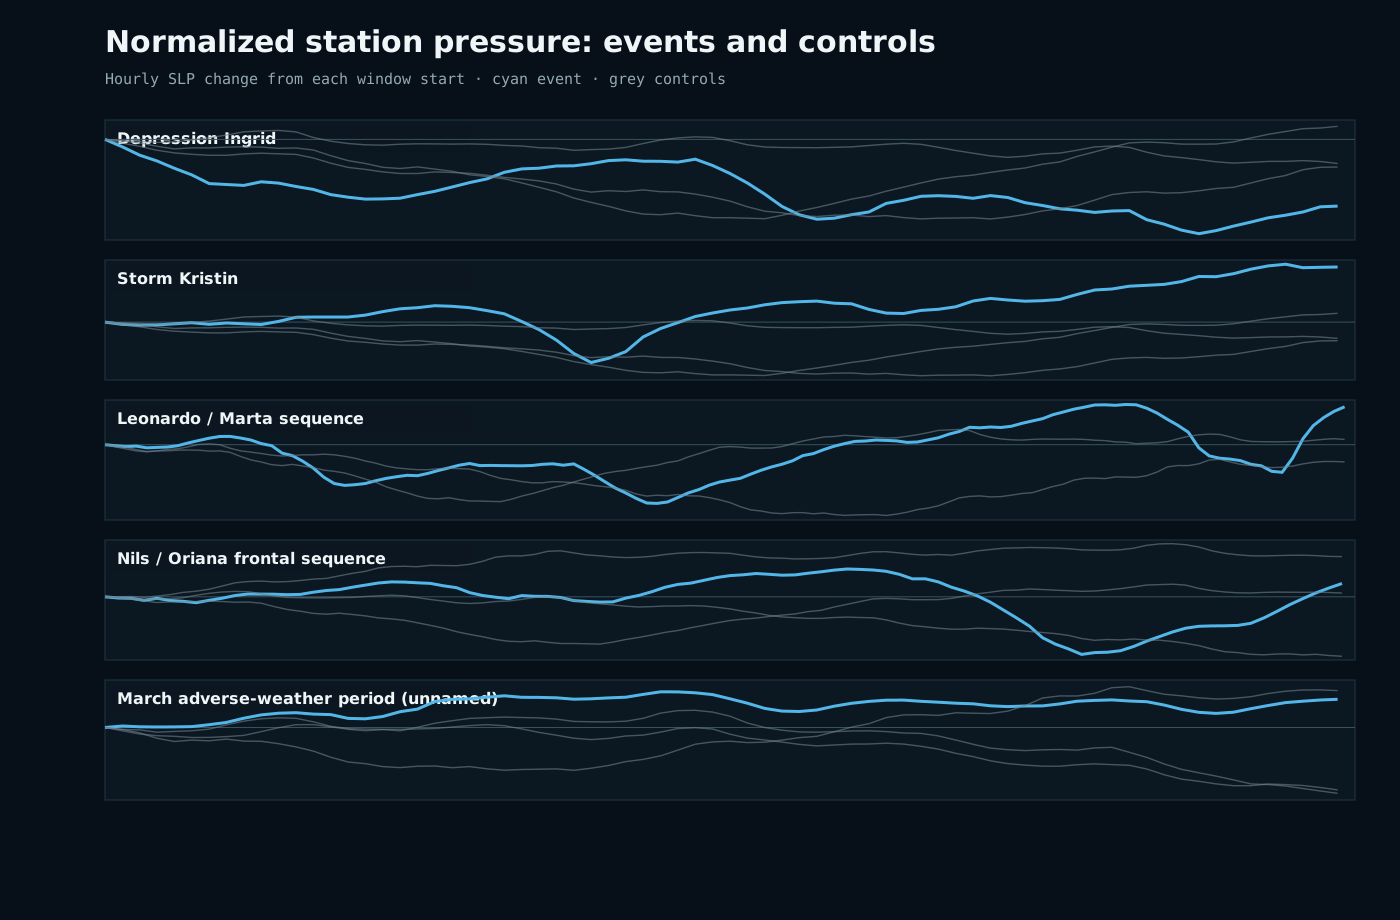
The Nils / Oriana window contains the largest 12-hour fall among the five approved comparison windows. The magnitude is compelling because its scope is precise: one local EDS station, one frozen analysis method, one defined window.
Strong evidence does not need a larger claim.
This value records a rapid change in hourly mean sea-level pressure at Espinho. It does not measure national storm intensity, wind, rainfall, waves, flooding or damage.
 Enlarge figure
 Enlarge figure
Negative evidence
The method also had to say no.
Keeping qualified and negative cases visible prevents the story from becoming a highlight reel. A national warning period and a named depression do not guarantee a major pressure transition at one local station.
Ingrid · below threshold
Noticeable, but not promoted.
-8.855 hPa · 6 hIngrid's fall is more negative than every selected control, but it misses the frozen six-hour threshold. The note preserves that result as substantial local movement, not as a supported discovery episode.
5 to 7 March · no major signature
A warning period can remain locally quiet.
-2.866 hPa · 6 hThe official adverse-weather period produced no major local pressure signature. That result is compatible with regional warning context and demonstrates why local observation and national guidance answer different questions.
Claims and limits
Observation is not prediction.
This field note tests whether a preserved local record captures repeatable environmental transitions around independently documented storm sequences. It does not test whether EDS forecast them.
Observed
What the station recorded
- Minute-level local continuity.
- Pressure, humidity, temperature and dew-point behavior.
- Strong and weak local transitions.
Supported
What the comparison shows
- Three station episodes overlap official sequences.
- Event-versus-control differences are reproducible under the frozen method.
- Ingrid and March remain qualified or negative.
Not established
What this note cannot claim
- Forecast accuracy or warning lead time.
- Historical advisory or action performance.
- Wind, rainfall, waves, impacts or national severity.
Data, method and references
The public record is smaller than the research workspace.
These downloads contain approved public-safe metrics, comparisons, integrity summaries and methods. They exclude raw BSON, complete raw telemetry, identifiers, internal logs and private infrastructure data.
Every published file is recorded with SHA-256 identity and provenance in the download manifest.
Event candidate matrix
Five approved windows, station metrics, controls and threshold outcomes.
Download CSVStation integrity summary
Daily row counts, minute-bin coverage, cadence and gap measures.
Download CSVApproved candidate metrics
Machine-readable core metrics and event results used by this note.
Download JSONNormalized event and control comparison
Public-safe vector figure for all five approved windows.
Download SVG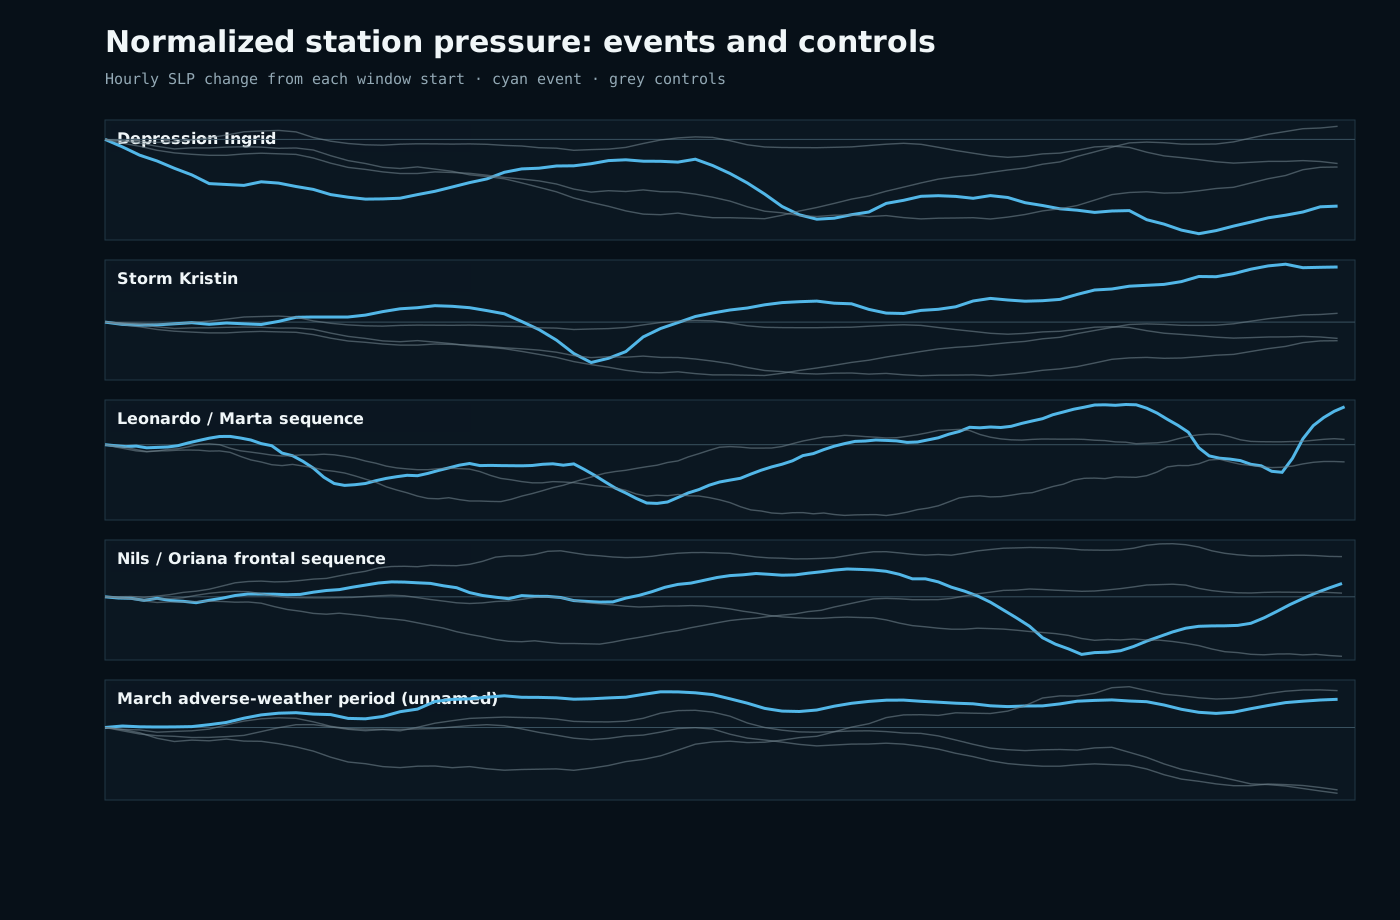
Public methodology
Frozen discovery, control-selection and historical-output rules.
Download methodOfficial reference timeline
Approved IPMA, ANEPC and APA event-context records.
Download CSVPrivacy and claim statement
Public boundaries for privacy, timing and scientific language.
Download statementDownload manifest
SHA-256 identity, source path and provenance for every published artifact.
Download manifestOfficial references
- ANEPCNotice for Ingrid, 22 January 2026
- IPMAStorm Kristin technical note
- ANEPCNotice for Kristin, 27 January 2026
- ANEPCNotice for Leonardo, 3 February 2026
- IPMAFebruary 2026 climatological bulletin
- ANEPCNotice for Oriana
- ANEPCMarch adverse-weather notice archive
- IPMAMarch 2026 climatological bulletin
- APACoastal monitoring context after the 2025 and 2026 storms